I still remember the first time I opened a stock chart; it looked like a heartbeat monitor during a rollercoaster ride.
Red and green bars, strange acronyms like RSI and MACD, and numbers that kept dancing with no rhythm.
Like many beginner investors in the U.S., I was overwhelmed. But over time, I discovered that reading stock market charts isn’t rocket science; it just requires the right approach and mindset.
In this guide, I’ll walk you through how to read stock market charts and trends with clarity.
Whether you’re trading your first share of Apple or researching ETFs for your Roth IRA, you’ll learn how to make informed decisions, avoid rookie mistakes, and navigate your investing journey confidently.
Let’s dive in.
What Is a Stock Chart and Why Does It Matter
A stock chart is a visual representation of a stock’s price movement over time.
It shows how a stock has historically performed and provides clues about where it might head next. Charts help you:
- Spot trends (bullish or bearish)
- Identify entry and exit points
- Understand market psychology
- Make data-driven decisions instead of emotional ones
Most stock charts are available on platforms such as Yahoo Finance, Robinhood, Fidelity, and Thinkorswim.
The Basics – Timeframes, Price Axes, and Volume
:max_bytes(150000):strip_icc()/dotdash_final_Price_by_Volume_Chart_PBV_Dec_2020-01-fa603cf762884966b3011aab59426e24.jpg)
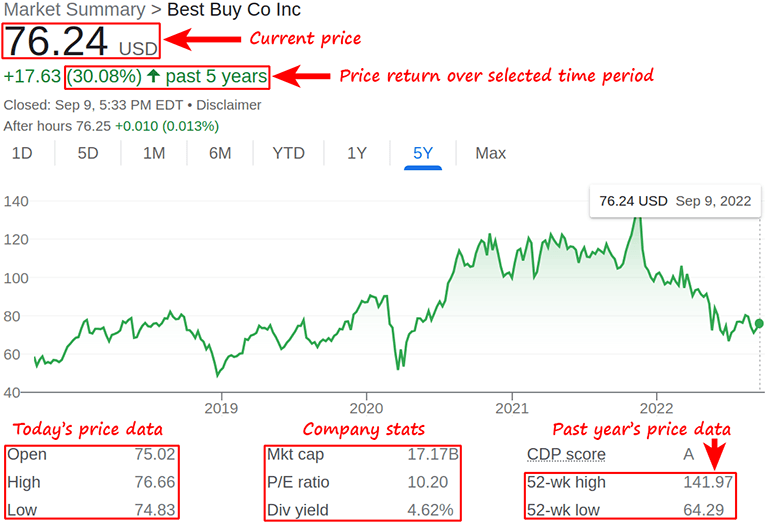
Every stock chart has two axes:
- Y-axis (vertical): Represents the stock price
- X-axis (horizontal): Represents time (from minutes to years)
You can choose different time frames depending on your goals:
- 1D or 1W: Day/swing trading
- 1M, 6M, YTD: Short-term investment
- 1Y, 5Y, Max: Long-term investing
Most charts also display volume bars, which indicate the number of shares traded at a given time. High volume typically means strong interest or volatility.
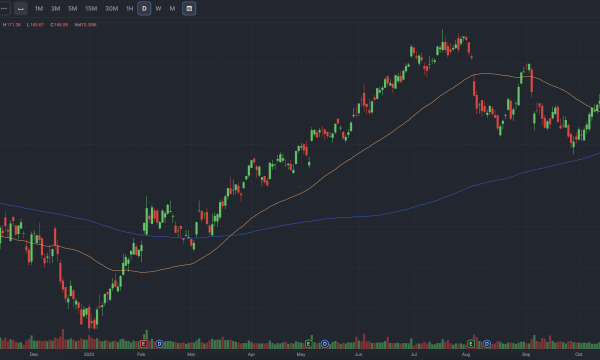
Understanding Candlestick Charts
Candlestick charts are the most common type of stock chart. Each candle shows four data points:
- Open: Where the price started
- Close: Where the price ended
- High: The highest price during the time frame
- Low: The lowest price
Green candles indicate that the stock closed higher than it opened (bullish), while red candles indicate that it closed lower (bearish).
Common Candlestick Patterns
- Doji: Indecision in the market
- Hammer: Potential bullish reversal
- Shooting Star: Bearish signal
- Engulfing: Trend reversal (bullish or bearish)
Learning these patterns helps you anticipate shifts in market sentiment.
Identifying Stock Market Trends
A trend is the general direction a stock’s price is moving. Recognising trends helps you ride the wave rather than swim against it.
Types of Trends
- Uptrend: Higher highs and higher lows (bullish)
- Downtrend: Lower highs and lower lows (bearish)
- Sideways/Consolidation: Flat movement; indecision
Use trendlines to connect lows (in an uptrend) or highs (in a downtrend). This visual aid helps you understand market momentum.
Key Technical Indicators for Beginners
You don’t need to memorise 50 indicators. These four are a great start:
1. Moving Averages (MA)
Smooth out price action. The 50-day and 200-day MAs are popular.
2. Relative Strength Index (RSI)
Measures momentum. Values over 70 mean overbought; values under 30 mean oversold.
3. MACD (Moving Average Convergence Divergence)
Shows trend changes and momentum. Look for crossovers.
4. Volume
High volume often confirms strong moves. Watch for spikes.
Tools like TradingView and ThinkorSwim offer these indicators free.
Putting It All Together – Practical Analysis
Let’s say you’re looking at Tesla (TSLA):
- It’s in an uptrend with a clear ascending channel.
- Volume spikes follow earnings announcements.
- RSI is at 80, maybe it’s overbought.
- A bearish engulfing candle appears.
In this case, you might wait for a pullback or confirm with MACD before buying.
Common Mistakes to Avoid
- Chasing green candles: Don’t FOMO into spikes.
- Ignoring volume: Always check volume for validation.
- No stop-loss strategy: Risk management is key.
- Overcomplicating analysis: Stick to 2–3 indicators.
- Relying only on charts: Always pair technicals with fundamentals. m
Resources to Practice Reading Charts
- Investopedia’s Simulator
- TradingView (free and paid plans)
- Yahoo Finance charts
- Robinhood or Fidelity’s stock analysis tools
- YouTube channels like ZipTrader or The Plain Bagel
Practice is the best teacher. Start with demo accounts before using real money.
Conclusion
Understanding how to read stock market charts gives you a major edge as an investor. It’s not about predicting the future, but about recognizing patterns and managing risk.
Whether you’re saving for your first home or diversifying your 401(k), learning to read charts helps you make smarter decisions with your hard-earned dollars.
So open up that first chart again, this time, you’ve got the playbook.